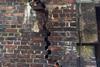


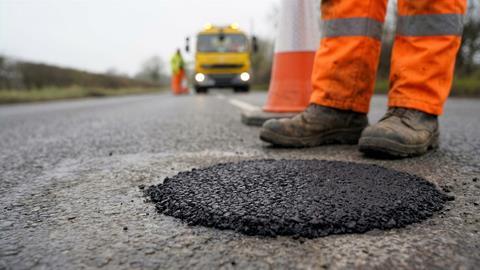

Northamptonshire has the worst road surfaces of anywhere in the UK, with the west of the county topping the list and North Northamptonshire coming in third place.
According to software firm Re-Flow Field Management, around 83% of West Northamptonshire’s roads need improvement.
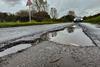
Just 24.5% of its A roads and motorways are rated green, while 71% fall into the amber category, meaning significant wear and needing repairs.
Its analysis of department for transport data found 5% of these major routes show serious damage and fall into the red.
The situation is similar on B and C roads, where only 9.5% are in good condition.
Sitting between the two areas of Northamptonshire in second place is Derbyshire, where 20.4% of the A roads and motorways passing through the county fall into the red category, the highest in the UK.
Only 32.5% are rated green.
And despite being one of the wealthiest London boroughs, Westminster appears in the top 10 worst areas, with 16.5% of the roads classed as red.
However, at the other end of the spectrum, Sunderland was found to have the best roads, with 87.6% rated green and just 1% red. Middlesbrough has the second best roads and Leeds was rated third.
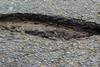
A recent survey found the state of UK roads is worse than it was 12 months ago, with eight out of 10 respondents saying councils weren’t fixing holes quickly enough and when they were resurfaced, fixes were failing within days or weeks.
Ashley Wing, Re-flow Field Management’s chief marketing officer, said: “These results show a concerning picture of the UK’s road infrastructure, with significant regional disparities in road quality.
“What’s particularly worrying is seeing areas like Westminster in the top 10, showing that even wealthy boroughs aren’t immune to road maintenance issues.
“Areas like West Northamptonshire face a double challenge with poor quality across both major and minor roads. This puts tremendous pressure on local authorities who must balance urgent repairs against dwindling budgets.”
Top 10 UK areas with the worst road surfaces
| Rank | Local authority | Percentage of A roads in red status | Percentage of A roads in amber status | Percentage of B & C roads in red status | Percentage of B & C roads in amber status |
|---|---|---|---|---|---|
|
1. |
West Northamptonshire |
5% |
71% |
17.5% |
72.5% |
|
2. |
Derbyshire |
20.4% |
44% |
27% |
47.6% |
|
3. |
North Northamptonshire |
3% |
71% |
10% |
82% |
|
4. |
Bristol, City of |
8.8% |
63.2% |
10% |
74.6% |
|
5. |
Southend-on-Sea |
12.6% |
47% |
19.8% |
51.8% |
|
6. |
Bath and Northeast Somerset |
5% |
56% |
17% |
60.5% |
|
7. |
Bradford |
6.67% |
62.67% |
9.33% |
63% |
|
8. |
Liverpool |
9.8% |
45.2% |
15% |
54.75% |
|
9. |
Cheshire West and Chester |
1% |
64.8% |
4.4% |
72.4% |
|
10. |
Westminster |
4% |
32% |
16.5% |
71.5% |