
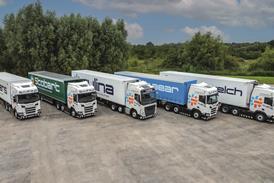


Motor Transport Top 100 2017
Welcome to the Motor Transport Top 100 2017. This is the definitive list of the largest operators of commercial vehicles in the UK; by turnover; by pre-tax profit and by employee numbers. Our interactive tables, exclusive to Motor Transport.co.uk, provide the quickest and easiest way to benchmark the performance of ...
This article is for registered users only
Please login or create a FREE account to read the full article
Want to read more?
Register now for free to access the full article.
To access our great content on the Motor Transport website and to get a free copy of our weekly Executive Brief newsletter.
Once registered, you’ll get access to:
- In-depth breaking news every working day of the year
- All the best careers advice for you and your business
- Profiles of every winner at the Motor Transport Awards
- The richest set of road transport industry data in the UK
- You may also be eligible for a free print or digital copy of Motor Transport