


In 2016 the UK road transport industry moved more freight by both weight and distance than it has ever done since modern records began
According to newly published figures the UK road transport industry (excluding Northern Ireland) lifted freight amounting to 1.89 billion tonnes in 2016; a 15% increase year-on-year. This is the highest recorded collective weight since comparative records began in 1990.
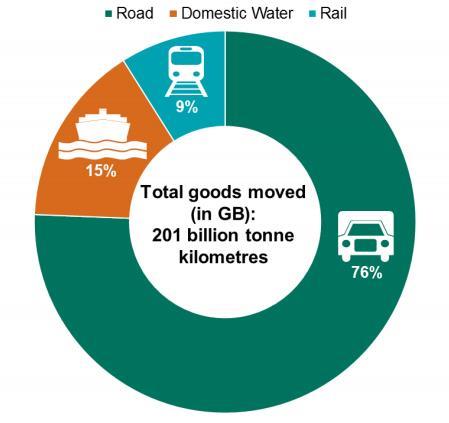
Hauliers also racked up 170 billion tonne-km, the weight of goods carried multiplied by the distance hauled, in 2016, a 12% increase on the previous year. This was another record, representing the highest figure on record, according to the DfT.
While vehicle kilometres increased by 5% in the year to 19.2 billion, the DfT said the overall trend was one of decline. In 1998, a historic peak, hauliers undertook 23.3 billion vehicle kilometres. This, the department added, suggests the road transport industry has become more efficient over time.
Despite this, empty running was 30% in 2016 compared with 27% in 2006. Average fuel consumption of diesel-powered vehicles above 3.5 tonne was 8.5mpg in 2016. It was 8mpg for artics (both unchanged from the year before).
Where’s it come from, where’s it going?
Based on an EU-wide geography classification, known as Nuts (Nomenclature of Territorial Units for Statistics), there are 173 regions in the UK.
In 2016 the Nuts-3 regions (counties, unitary authorities, council areas or districts) that had the greatest amount of road freight tonnage originating in them were: Suffolk, thanks to the UK’s largest container port Felixstowe (45.4 million tonnes); Oxfordshire, a biotech and high-end motorsport production area (45.3 million tonnes); Leicestershire and Rutland, a farming and food and drink production area (45.2 million tonnes).
Staffordshire, Lincolnshire and Thurrock, all above 42 million tonnes, are next in the league table.
In terms of the most common destinations by tonnage, Oxfordshire (48.9 million tonnes); Staffordshire (47 million tonnes); and Lincolnshire (40.3 million tonnes) topped the list.
What is it being moved on?
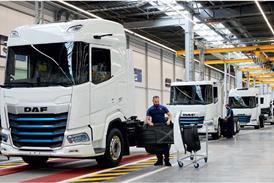
In 2016, 75% of goods moved were carried by articulated vehicles. This proportion has barely changed since 1996.
However, within the classification of both artic and rigid there has been a shift towards using larger HGVs when transporting goods. According to the DfT, the proportion of goods lifted by the largest rigid HGVS (over 25 tonnes) has increased from 46% in 1996 to 72% in 2016.
The proportion lifted by the largest articulated HGVs (over 33 tonnes) has jumped from 83% in 1996 to 96% in 2016.
The international dimension
Separately published international road freight figures – again excluding Northern Ireland – reveal more goods are imported by road to the UK than exported.
UK-registered HGVs travelling to or from the UK accounted for 7.8 million tonnes lifted (4 million of it imported) down 6% on 2015. This is a staggering 51% lower than the peak of 15.9 million tonnes lifted in 1999.
Of this, the DfT report shows 28% of goods lifted by UK-registered HGVs were carried between the UK and France; while 98% was to or from the EU15 block of countries (Austria, Belgium, Denmark, Finland, France, Germany, Greece, Ireland, Italy, Luxembourg, the Netherlands, Portugal, Spain, Sweden and the United Kingdom).
In comparison, in 2015 (the most recent figures available), 35.3 million tonnes of goods were lifted to and from the UK by foreign-registered HGVs, an increase of 4% on 2014. Polish-registered HGVs lifted the largest tonnage of goods in total of all the EU28 countries, lifting 8.9 million tonnes. Irish-registered HGVs and those based in the Netherlands continue to be major players in international work.
Based on the alternative measure of goods moved, the DfT states foreign HGV cabotage accounted for 1% of road freight activity, or 1.4 billion tonne-km moved within the UK in 2015.
Poland, the Netherlands and Ireland account for 55% of this, and the amount of cabotage done by Polish registered vehicles has increased tenfold since 2005 from 36 million tonne-km to 362 million tonne-km, largely at the expense of Belgium the Netherlands and Ireland, which have all declined.